The North Vancouver Housing Market Forecasts and Trends


Hello Friends, It’s Bill Coughlin! 

Have these Market Reports helped you?

💰 I’ve spent over $500,000 and 42 years creating the most accurate Real Estate Forecasts for Fraser Valley & Vancouver!

✅ If you find value in these reports — TEXT ME to let me know you want them to continue! 

❓Need help understanding what this means for your property?
📞 Call me for your Free Market Analysis of your home.

📲 Text me now at 778-374-3744. I’m here to help put More Money in Your Pocket!


North Vancouver Real Estate Market Reports and Forecasts  
Previous Reports

North Vancouver Market Update

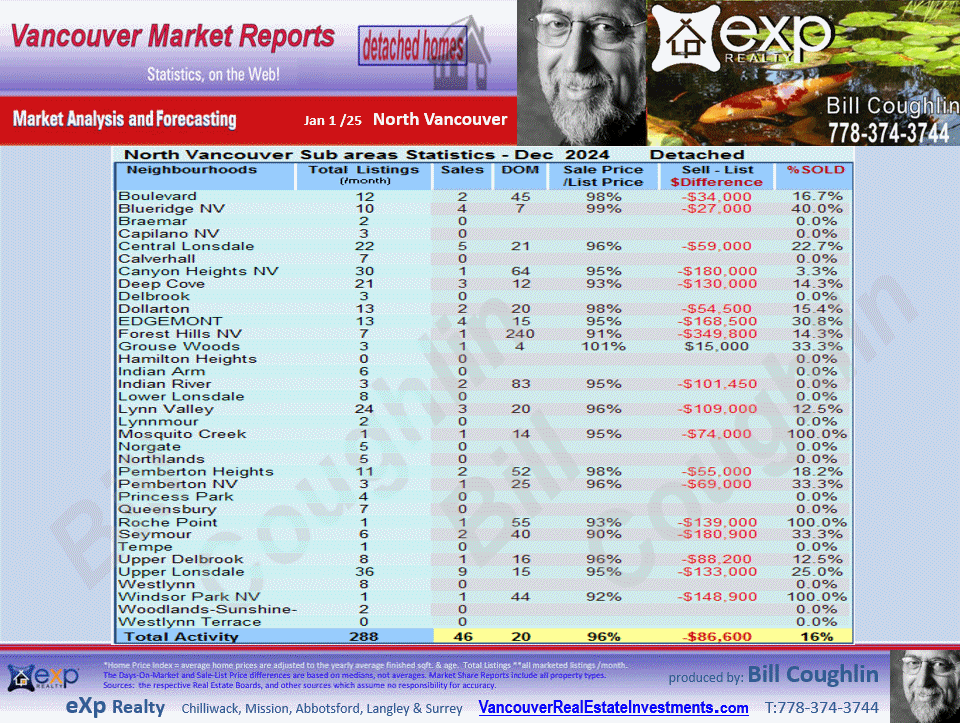
Lynn Valley, Upper Lonsdale, Deep Cove, Canyon Heights NV, Hamilton and all the sub-areas of North Vancouver Real Estate Market Update Report.

What are North Vancouver's Best and Worst Investments?

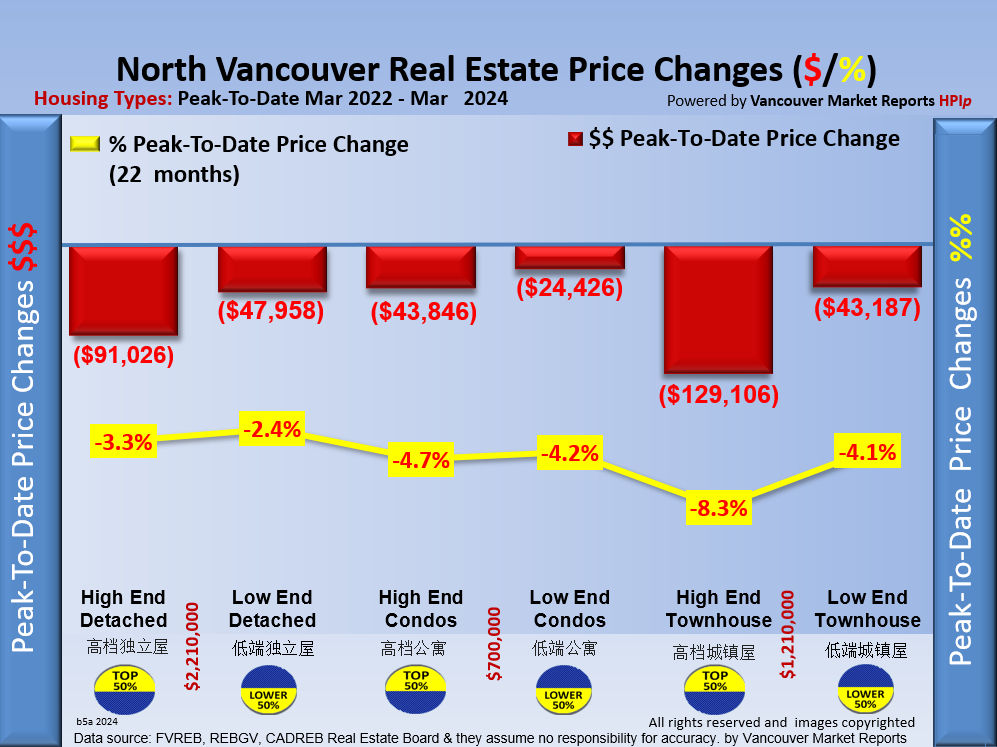
Archive Peak to Date Price Changes

Aug 1, 2026

gas gauge

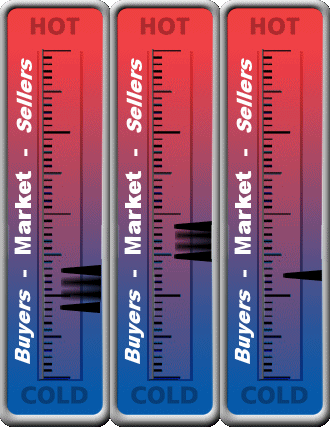
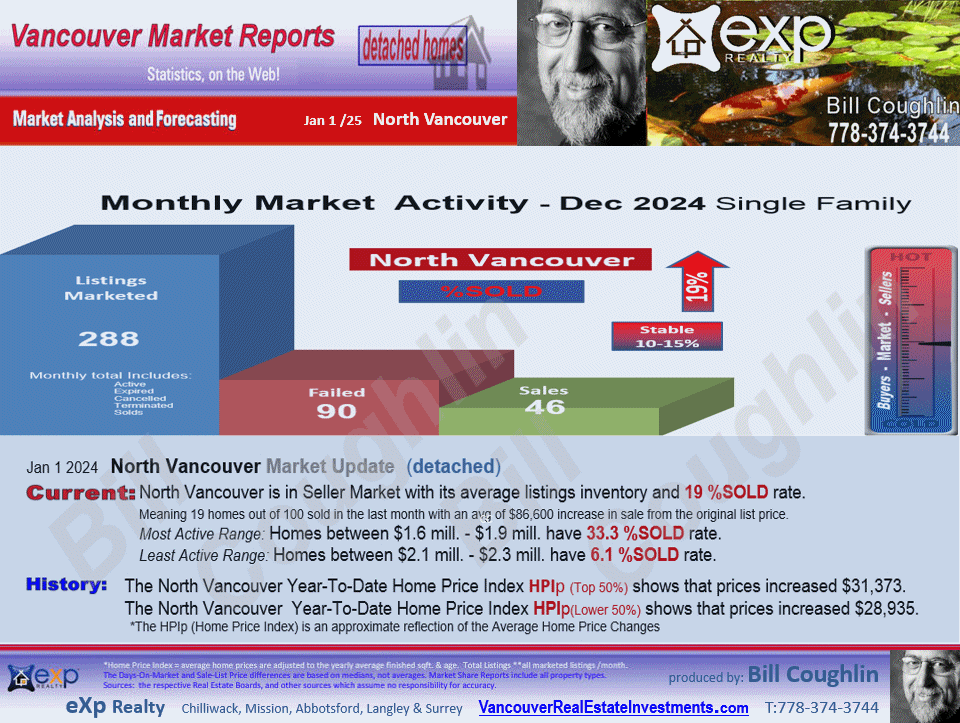
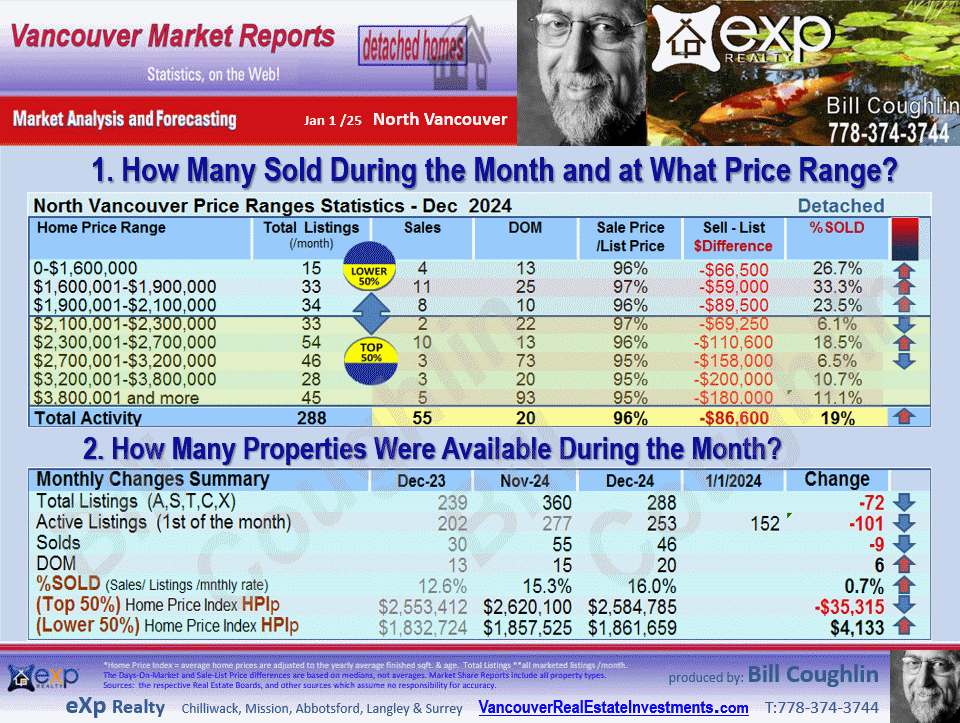
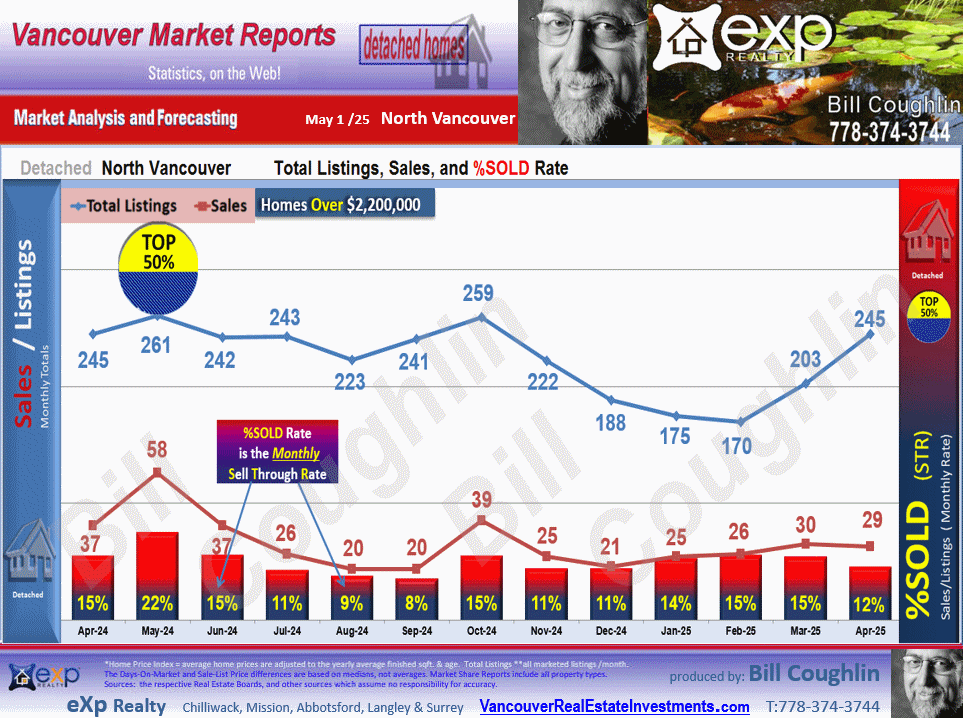
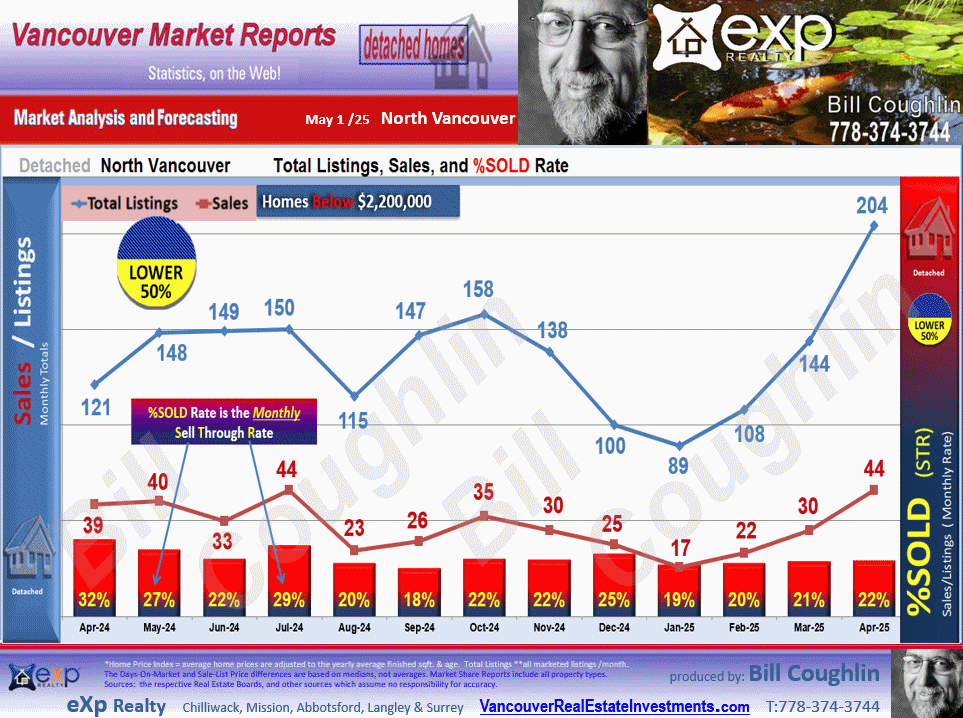
Current:  North Vancouver is in a Stable market with its average listings inventory and 12 %SOLD rate.
                 Meaning 12 homes out of 100 sold in the last month with an avg of  $98,500 increase on sale from the original list price.  

Most Active Range: Homes  between $1.6 mill. - $1.9 mill. have 20.2 %SOLD rate.  
Least Active Range: Homes below $1.6 mill. have 8.5 %SOLD rate.

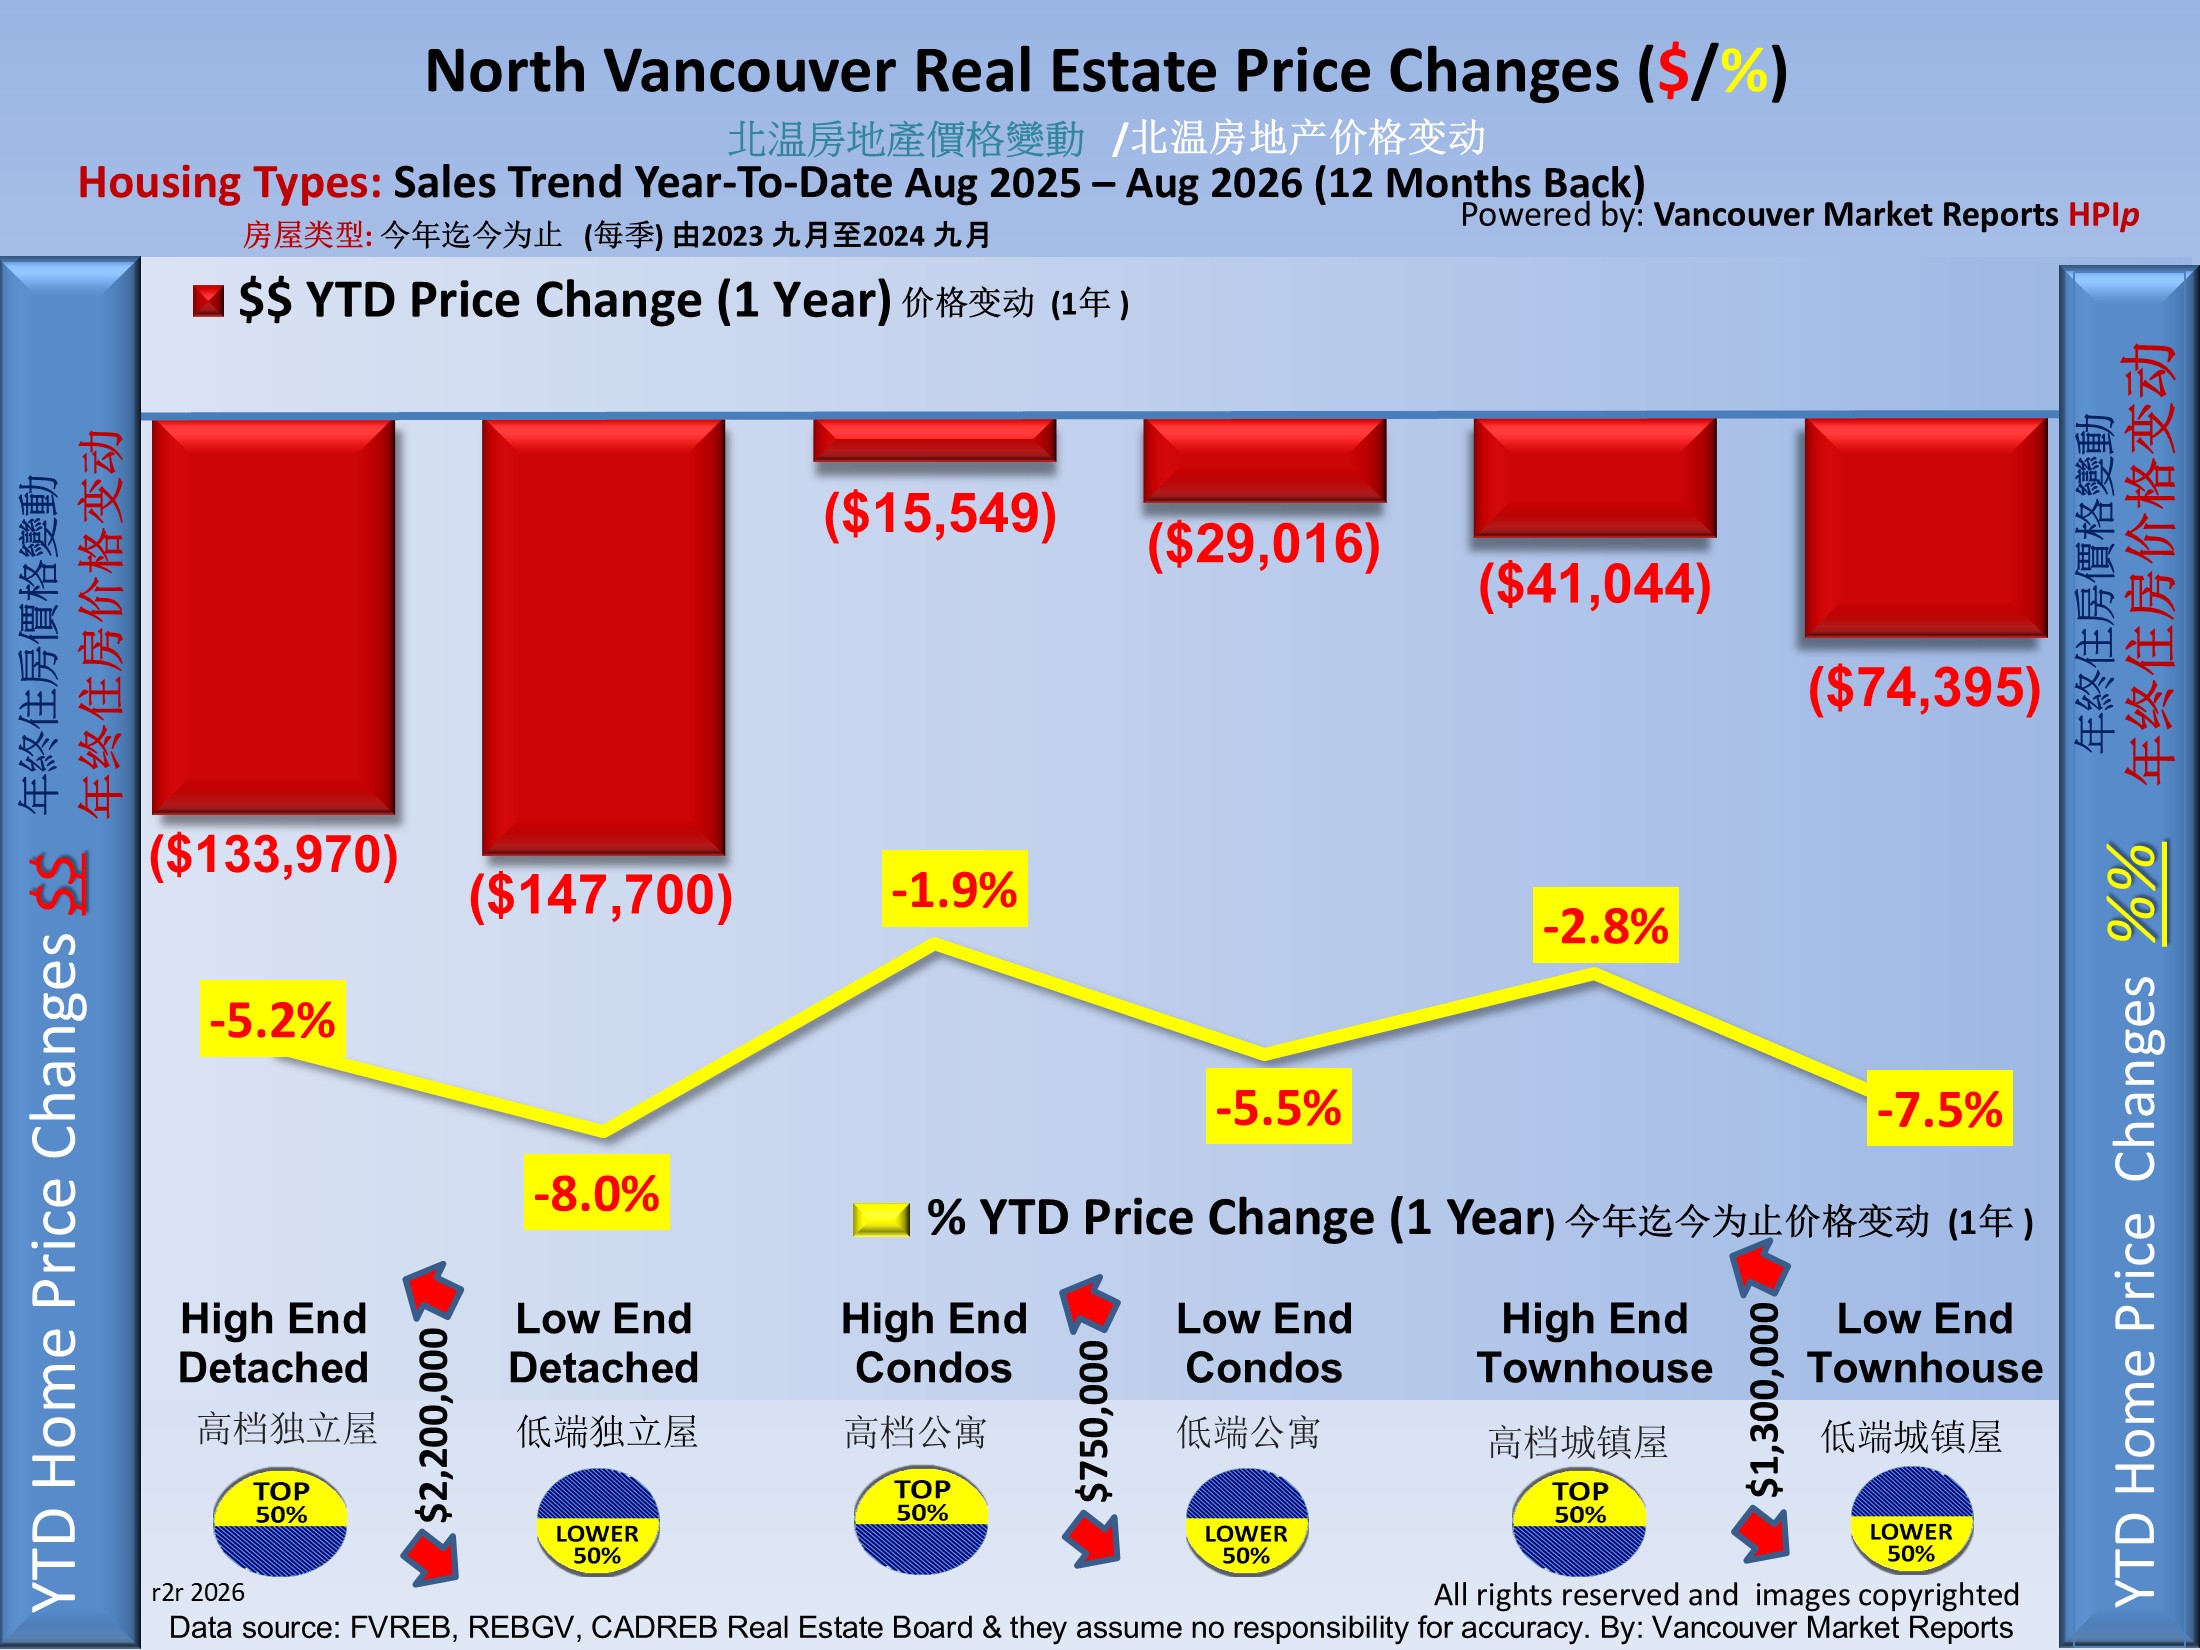
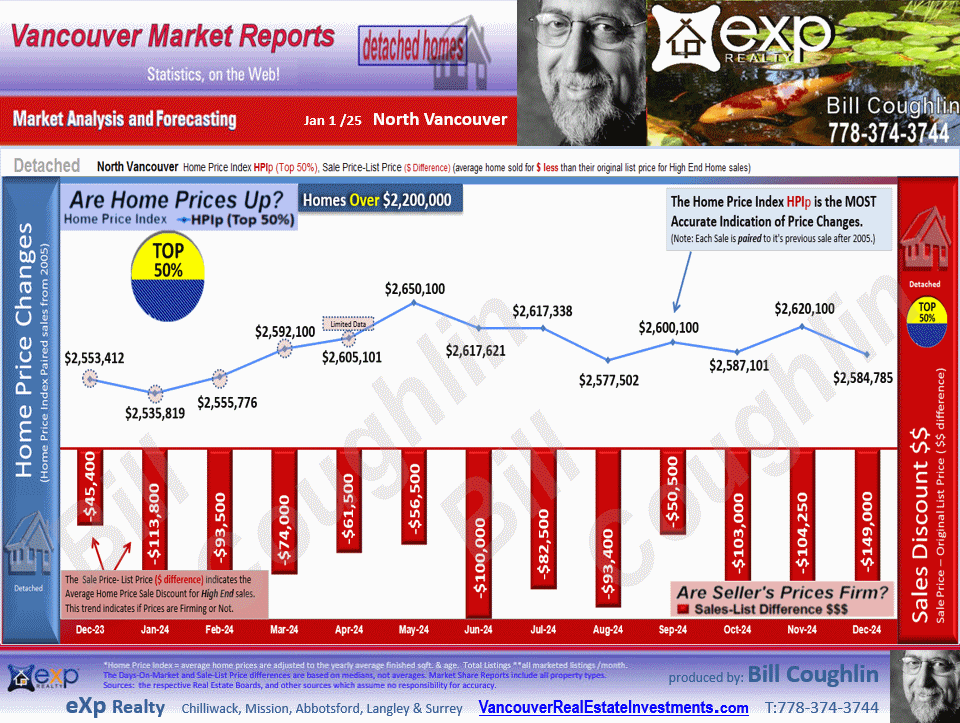
History: The North Vancouver Year-To-Date Home Price Index HPIp (Top 50%) shows that prices decreased $130,851.
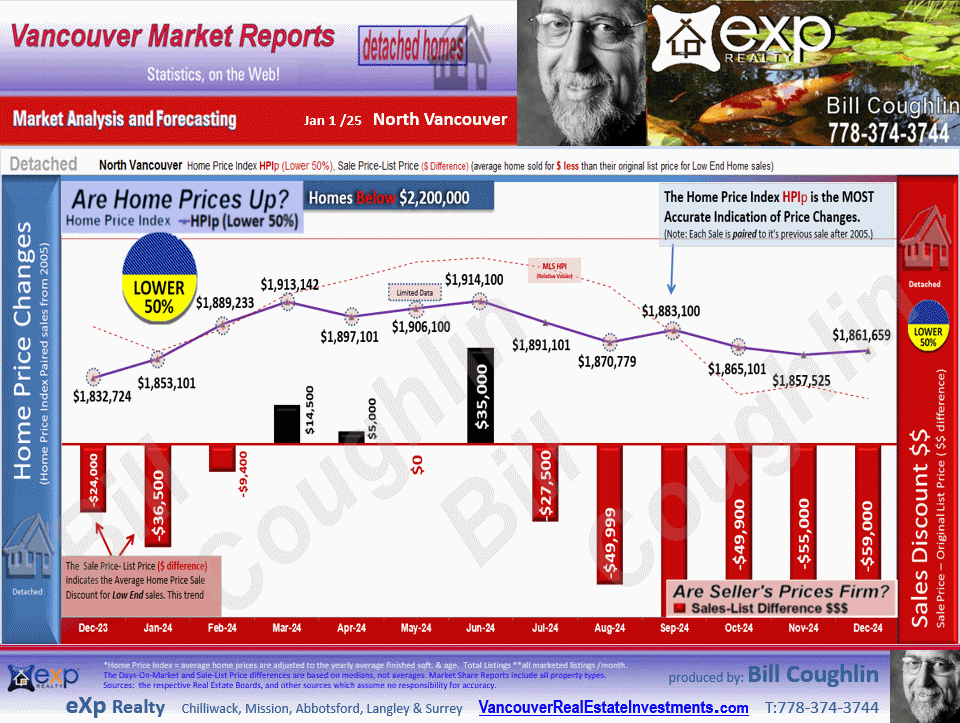
               The North Vancouver  Year-To-Date Home Price Index HPIp (Lower 50%) shows that prices decreased $153,302
                 *The HPIp (Home Price Index) is an approximate reflection of the Average Home Price Changes.

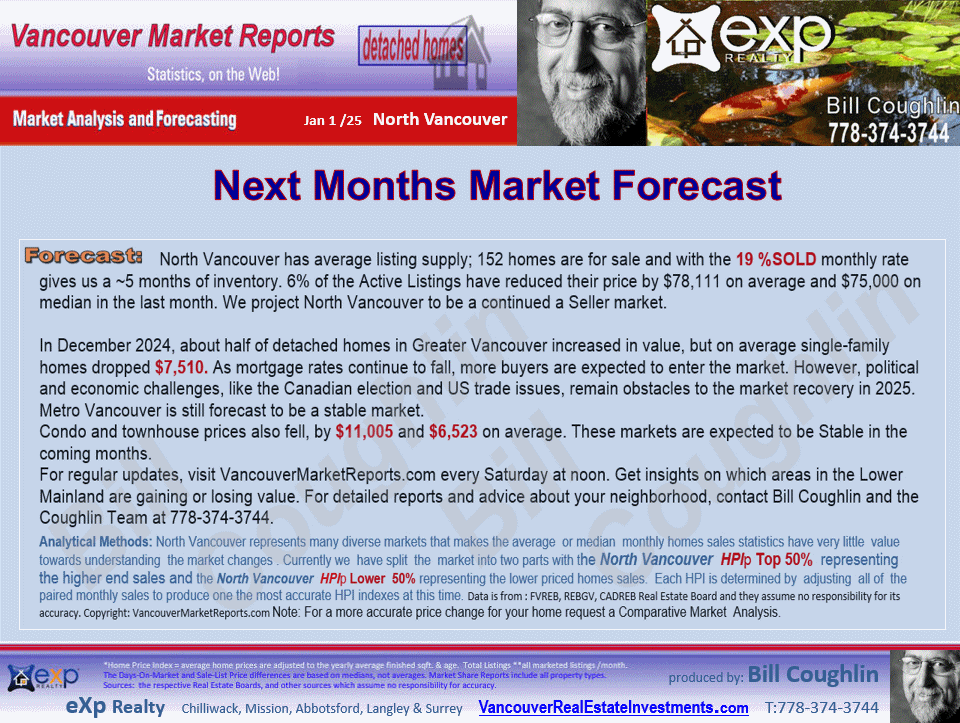
Forecast: North Vancouver has an average listing supply; 330 homes are for sale and with the 12 %SOLD monthly rate gives us a ~8 months of inventory. 8% of the Active Listings have reduced their price by $103,906 on average and $100,000 on median in the last month. We project North Vancouver to be a continued Stable market.

Greater Vancouver July 2026: 

The Metro Vancouver housing market slowed in July, with prices continuing to fall across most housing types. Detached home prices dropped by an average of $15,498. 71% of detached home markets saw price declines.

Condo prices also went down, with an average decrease of $7,846. 83% of Vancouver condo markets saw price declines. At the same time, townhome prices fell by an average of $8,656. 87% of Vancouver townhome markets saw price declines.

Looking ahead to next month, Metro Vancouver is expected to remain a declining market, with most detached homes, condos, and townhomes continuing to face downward price pressure. Consumer confidence is being dramatically challenged by our current trade war. Buyers may continue to have more negotiating power, while sellers may need to price competitively to attract buyers.

It’s more important than ever to know what’s happening in your local area. Want to see how your neighbourhood is performing? Check VancouverMarketReports.com every Saturday at noon for the latest Sell-Through Rates across all 17 cities. For expert advice or a free home market review, call Bill Coughlin and the Coughlin Team at 778-374-3744. We’re here to help you make the best move.


Fraser Valley July 2026: 

The Fraser Valley housing market remained very soft in July, with prices falling across all three major housing types. Detached home prices dropped by an average of $16,381. 78% of detached home markets saw price declines.

Condo prices decreased by an average of $4,771. 75% of Fraser Valley condo markets saw price declines. The same time townhome prices fell by an average of $8,261. 67% of Fraser Valley townhome markets saw price declines.

Looking ahead to next month, the Fraser Valley market is expected to remain a declining market, with most detached homes, condos, and townhomes continuing to face downward price pressure. Consumer confidence is being dramatically challenged by our current trade war. Buyers may continue to have more negotiating power, while sellers may need to price competitively to attract buyers.

It’s more important than ever to know what’s happening in your local area. Want to see how your neighbourhood is performing? Check VancouverMarketReports.com every Saturday at noon for the latest Sell-Through Rates across all 17 cities. For expert advice or a free home market review, call Bill Coughlin and the Coughlin Team at 778-374-3744. We’re here to help you make the best move.


   Disclaimer: Market predictions are exactly that: predictions. Market conditions are changing daily and you should consult with your local expert to confirm facts before making any decisions.


   We invite you to analyze your home value/investment in 30+ market areas by inputting your previous purchase price and date in the Evaluator below! See "Evaluator / Forecaster" movie for directions. To see your homes monthly price changes from now on, just email your report to yourself. (3 bars link to email function)


Vancouver real estate investments


Buy Gold / Silver Today


Hello Friends,
 It’s Bill Coughlin! 

📞 Call me for your Free Market Analysis of your home.

📲 Text me now at
778-374-3744.

I’m here to help put More Money in Your Pocket!

             
    North Vancouver Home Forecaster 

   North Vancouver's Home Evaluator / ROI / Forecaster
Single Family Detached High End .. more than $2,200,000       

What Is Your Home Value, Profit; Return On Investment?
              你的房屋价值 ,利润, 投资收益率知多少?


Date Value

                                                    计算你的房产价值;     与130的本地和全球市场比较你的投资利润
Calculate Your Home Value & Compare Your ROI to 130 Local & World Markets. 


cx


We thank Bill Coughlin for his support of these North Vancouver Market Updates which includes sub areas such as Canyon Heights NV, Lynn Valley, Upper Lonsdale, Deep Cove, Hamilton etc. Contact Bill as the Local Expert.... more details.

all the sub-areas of North Vancouver - Lynn Valley, Upper Lonsdale, Hamilton, Deep Cove, Canyon Heights NV.

all the sub-areas of North Vancouver - Lynn Valley, Upper Lonsdale, Hamilton, Deep Cove, Canyon Heights NV.

all the sub-areas of North Vancouver - Lynn Valley, Upper Lonsdale, Hamilton, Deep Cove, Canyon Heights NV.

all the sub-areas of North Vancouver - Lynn Valley, Upper Lonsdale, Hamilton, Deep Cove, Canyon Heights NV.

Download the full NorthVancouverMarketupdatereport.PDF

North Vancouver Market update includes the sub areas Canyon Heights NV, Hamilton, Lynn Valley, Deep Cove, Upper Lonsdale etc.

North Vancouver Market update includes the sub areas Canyon Heights NV, Hamilton, Lynn Valley, Deep Cove, Upper Lonsdale etc.

North Vancouver Market update includes the sub areas Canyon Heights NV, Hamilton, Lynn Valley, Deep Cove, Upper Lonsdale etc.

North Vancouver Market update includes the sub areas Canyon Heights NV, Hamilton, Lynn Valley, Deep Cove, Upper Lonsdale etc.

This North Vancouver Real Estate Market update includes the sub areas Deep Cove, Canyon Heights NV, Hamilton, Lynn Valley, Upper Lonsdale etc.


Click Image to compare previous STR/ MTI graphs            Trying to do the math? Lessons:  STR   MTI 

Ladner, South Delta, Real Estate Market Update Report


Hello Friends, It’s Bill Coughlin! 

Have these Market Reports helped you?

💰 I’ve spent over $500,000 and 42 years creating the most accurate Real Estate Forecasts for Fraser Valley & Vancouver!

✅ If you find value in these reports — TEXT ME to let me know you want them to continue! 

❓Need help understanding what this means for your property?
📞 Call me for your Free Market Analysis of your home.

📲 Text me now at 778-374-3744. I’m here to help put More Money in Your Pocket!


 North Vancouver           Real Estate Market Analysis Reports

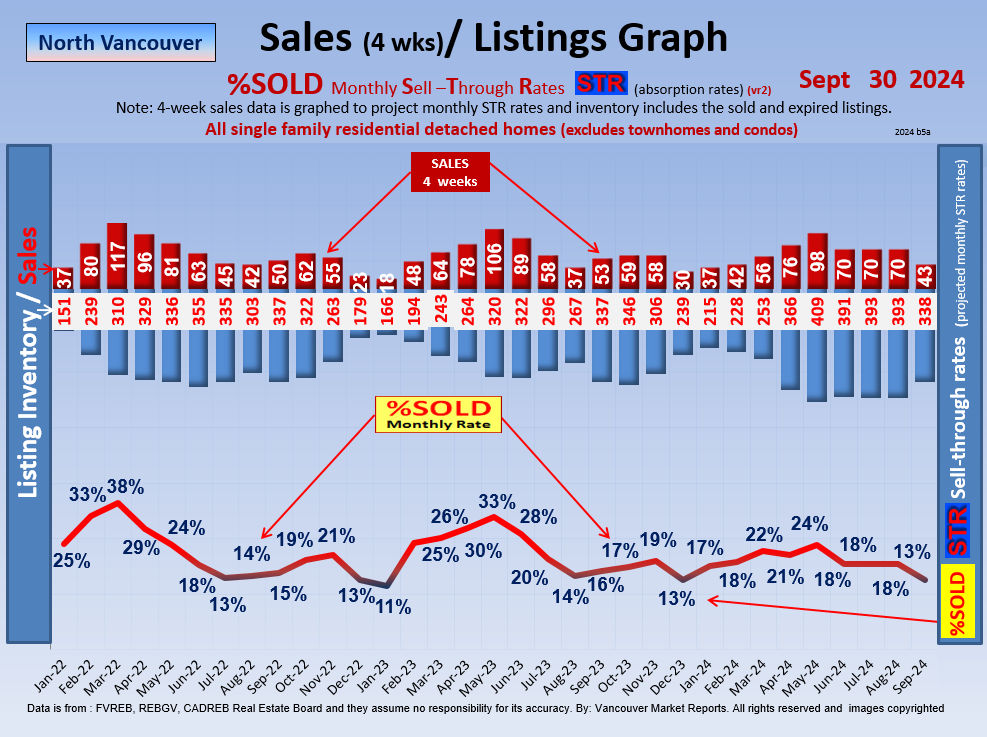
This is the most accurate  %SOLD-Monthly Sell Through Rates (STR Graph)  using a 4 week time period to analysis the housing prices and Market trends. This Market Report is derived from the exact Sat to Friday 4 week time periods and this is dramatically more accurate than the month to month comparisons that vary based on actual working days eg month, weekends. These trends enable Real Estate Market predictions and forecast outlooks.


Disclaimer: Market predictions are exactly that: predictions. Market conditions are changing daily and you should consult with your local expert to confirm facts before making any decisions.

  Registration for Monthly and Bi-Monthly Market Reports

  Vancouver and FV Market Reports and Forecasts


  Developers, Investors, Realtors or Financial Advisers.

  • Now you can be informed of the market changes as they happen.
    • Now you can receive bi-monthly updates.=
       
  • Each month we analyze the Real Estate Supply and Demand for 22 cities in the lower mainland: Vancouver to Chilliwack and we make the forecasts for the following month or more.

   Membership   Free,                 (Sponsored Realtors  Click here )

This is a free service to over 5 million viewers today!!! (

Request


*Full Name:
          
*Company:
          
*Email:
          
*City:
          

Hot New Listings

 Vancouver.real.estate.investments #温哥华房地产投资

 Real Estate
Market Reports

Index


Hello Friends,
 It’s Bill Coughlin! 

📞 Call me for your Free Market Analysis of your home.

📲 Text me now at
778-374-3744.

I’m here to help put More Money in Your Pocket!

RE/MAX Market Share Reports REMAX

BC Election Interviews

How Will this Election

Change the 

Real Estate Market zzz


  Members Login
DiscountOverlist Stats

Adian's Blog: news on Baby Boomers retirement issues  Click here


Vancouver.real.estate.investments #温哥华房地产投资

Bill Coughlin
EXP Realty

For Real Estate in Abbotsford, Mission, Langley, Surrey and Chilliwack

call me
1-778-374-3744

[email protected]


Bill Coughlin
"Realtor and Lifestyle Consultant"

1-778-374-3744 cell
1-888-539-4664
Toll free

[email protected]
CoughlinTeam.com  

EXP Realty
Serving the Greater Vancouver Cities 

Number of visits on this page: 60,124. Number of visits on this site: 19,436,401.