 |
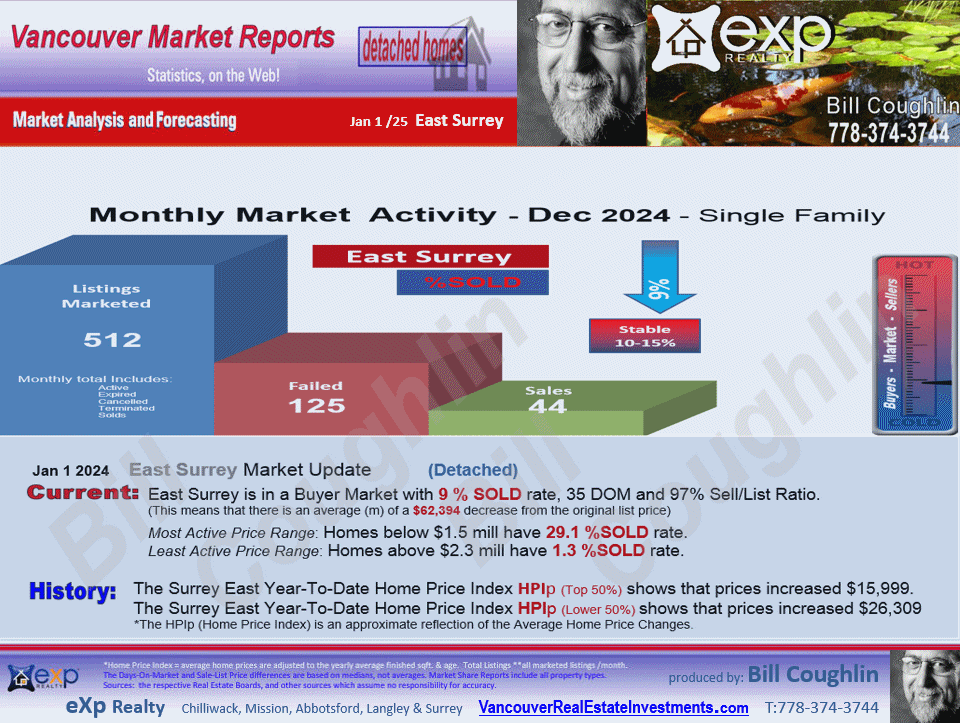
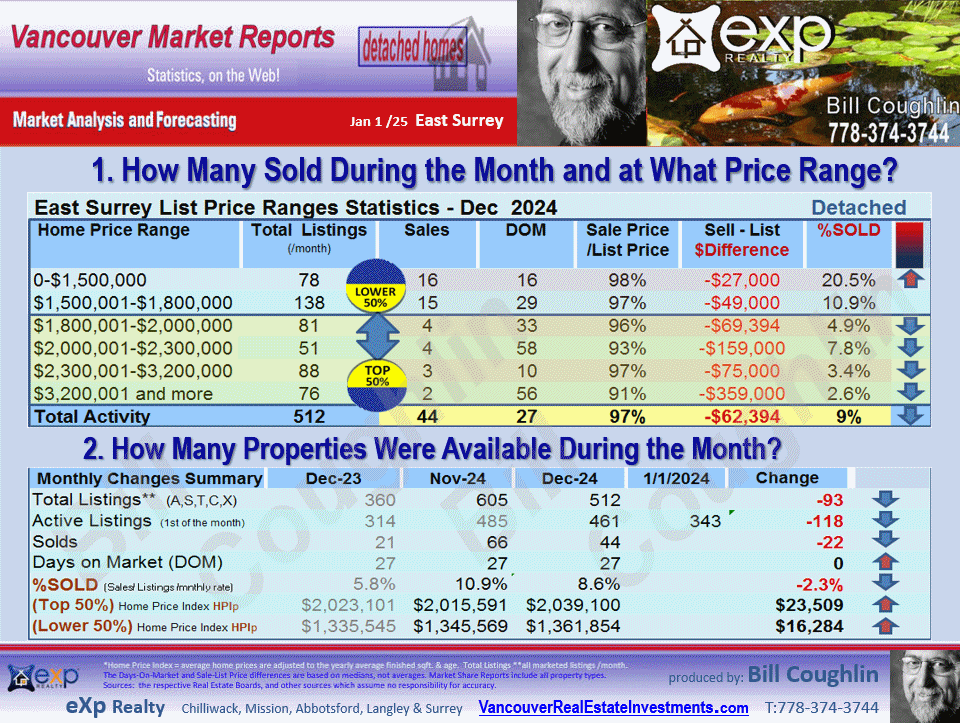
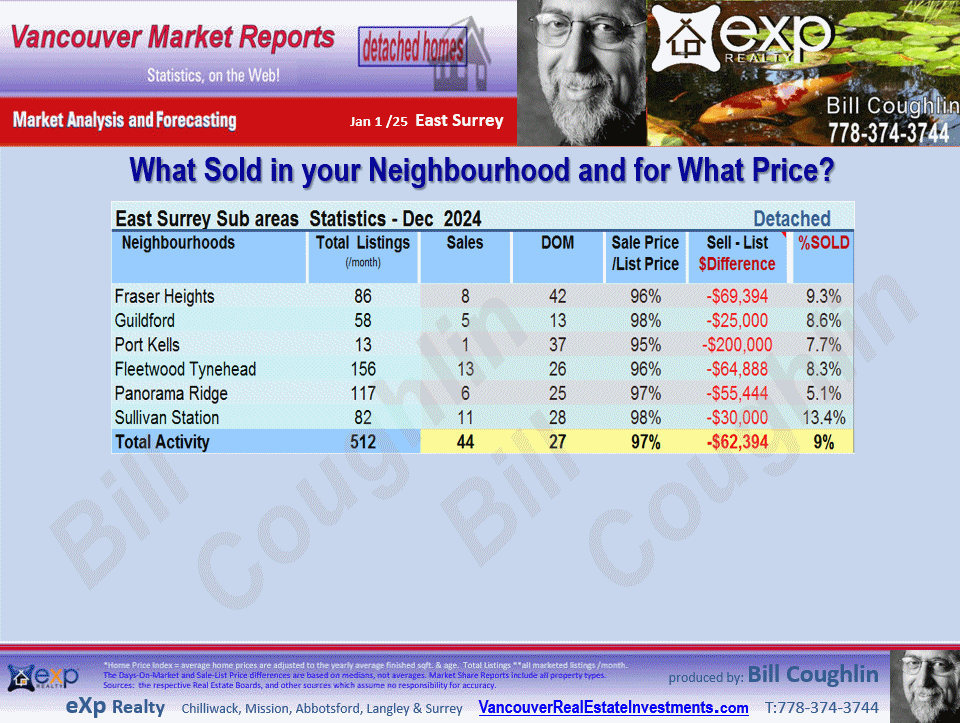
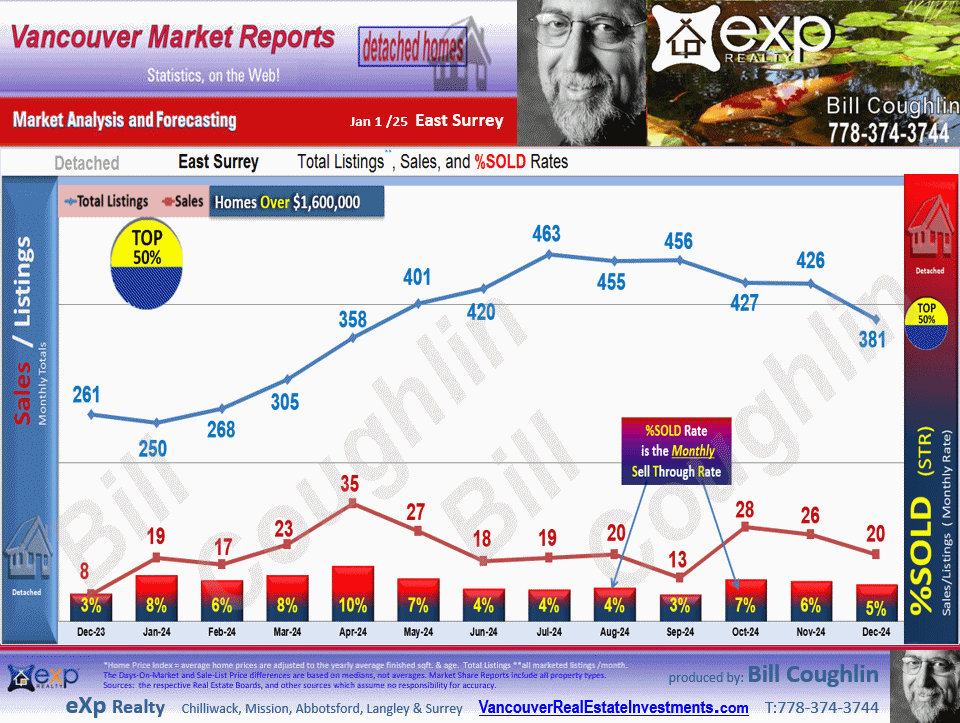
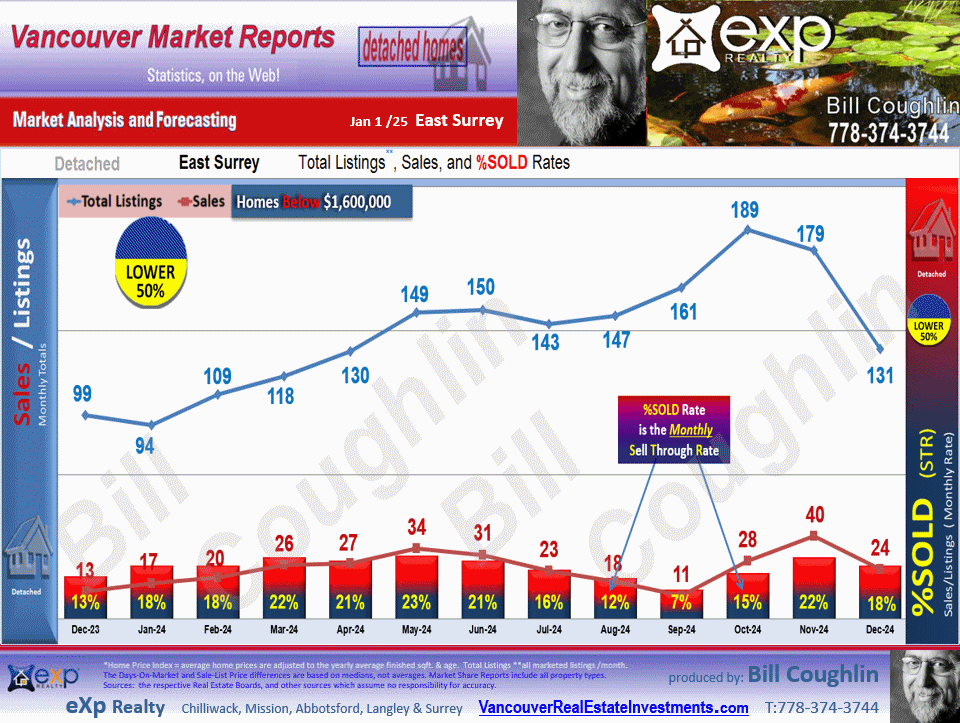
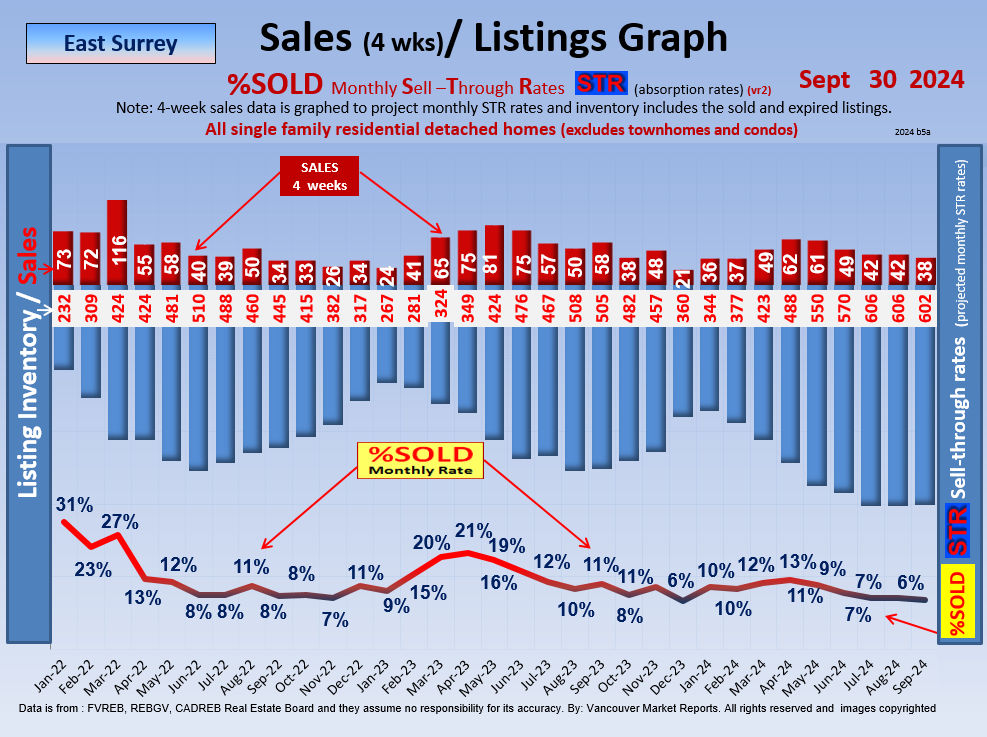
Current: East Surrey is in a Buyer Market with 6 %SOLD rate, 34 DOM and 96% Sell/List Ratio.
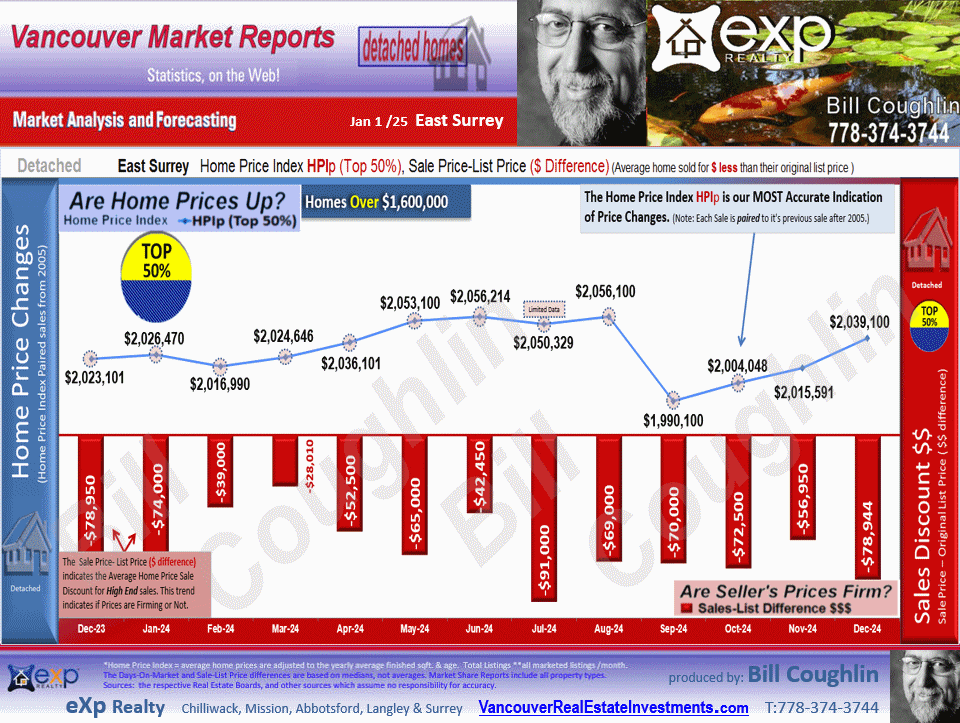
(This means that there is an average (m) of a $58,890 decrease from the original list price)
Most Active Range: Homes below $1.5 mill. have 9.9 % SOLD rate.
Least Active Range: Homes above $2.0 mill.-$2.3 have 0.0 %SOLD rate.
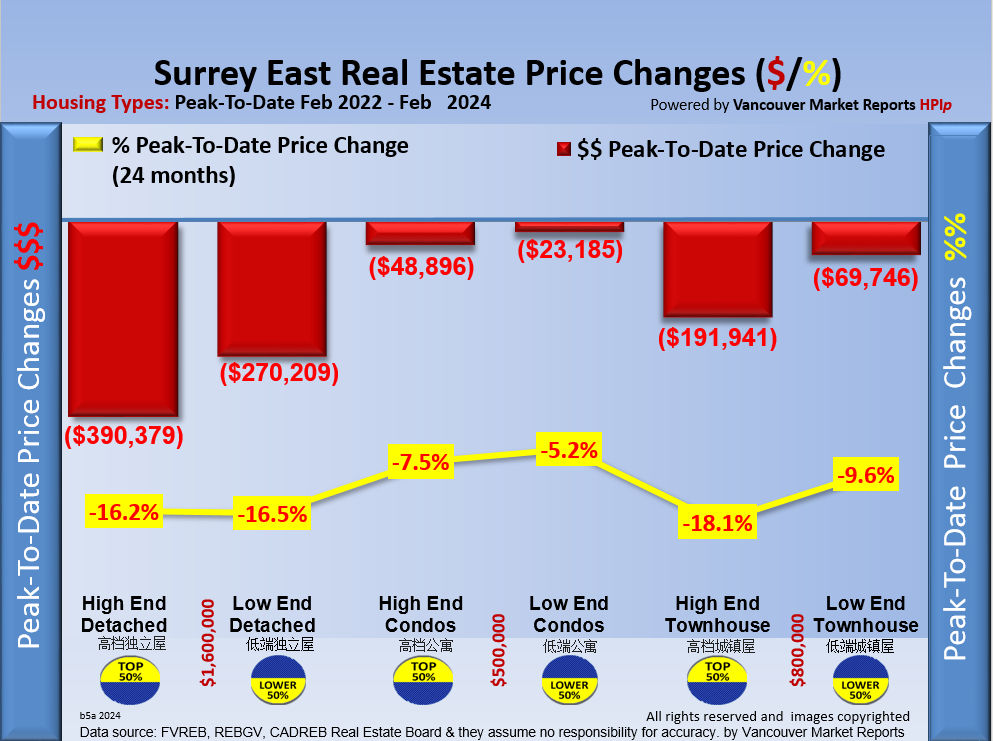
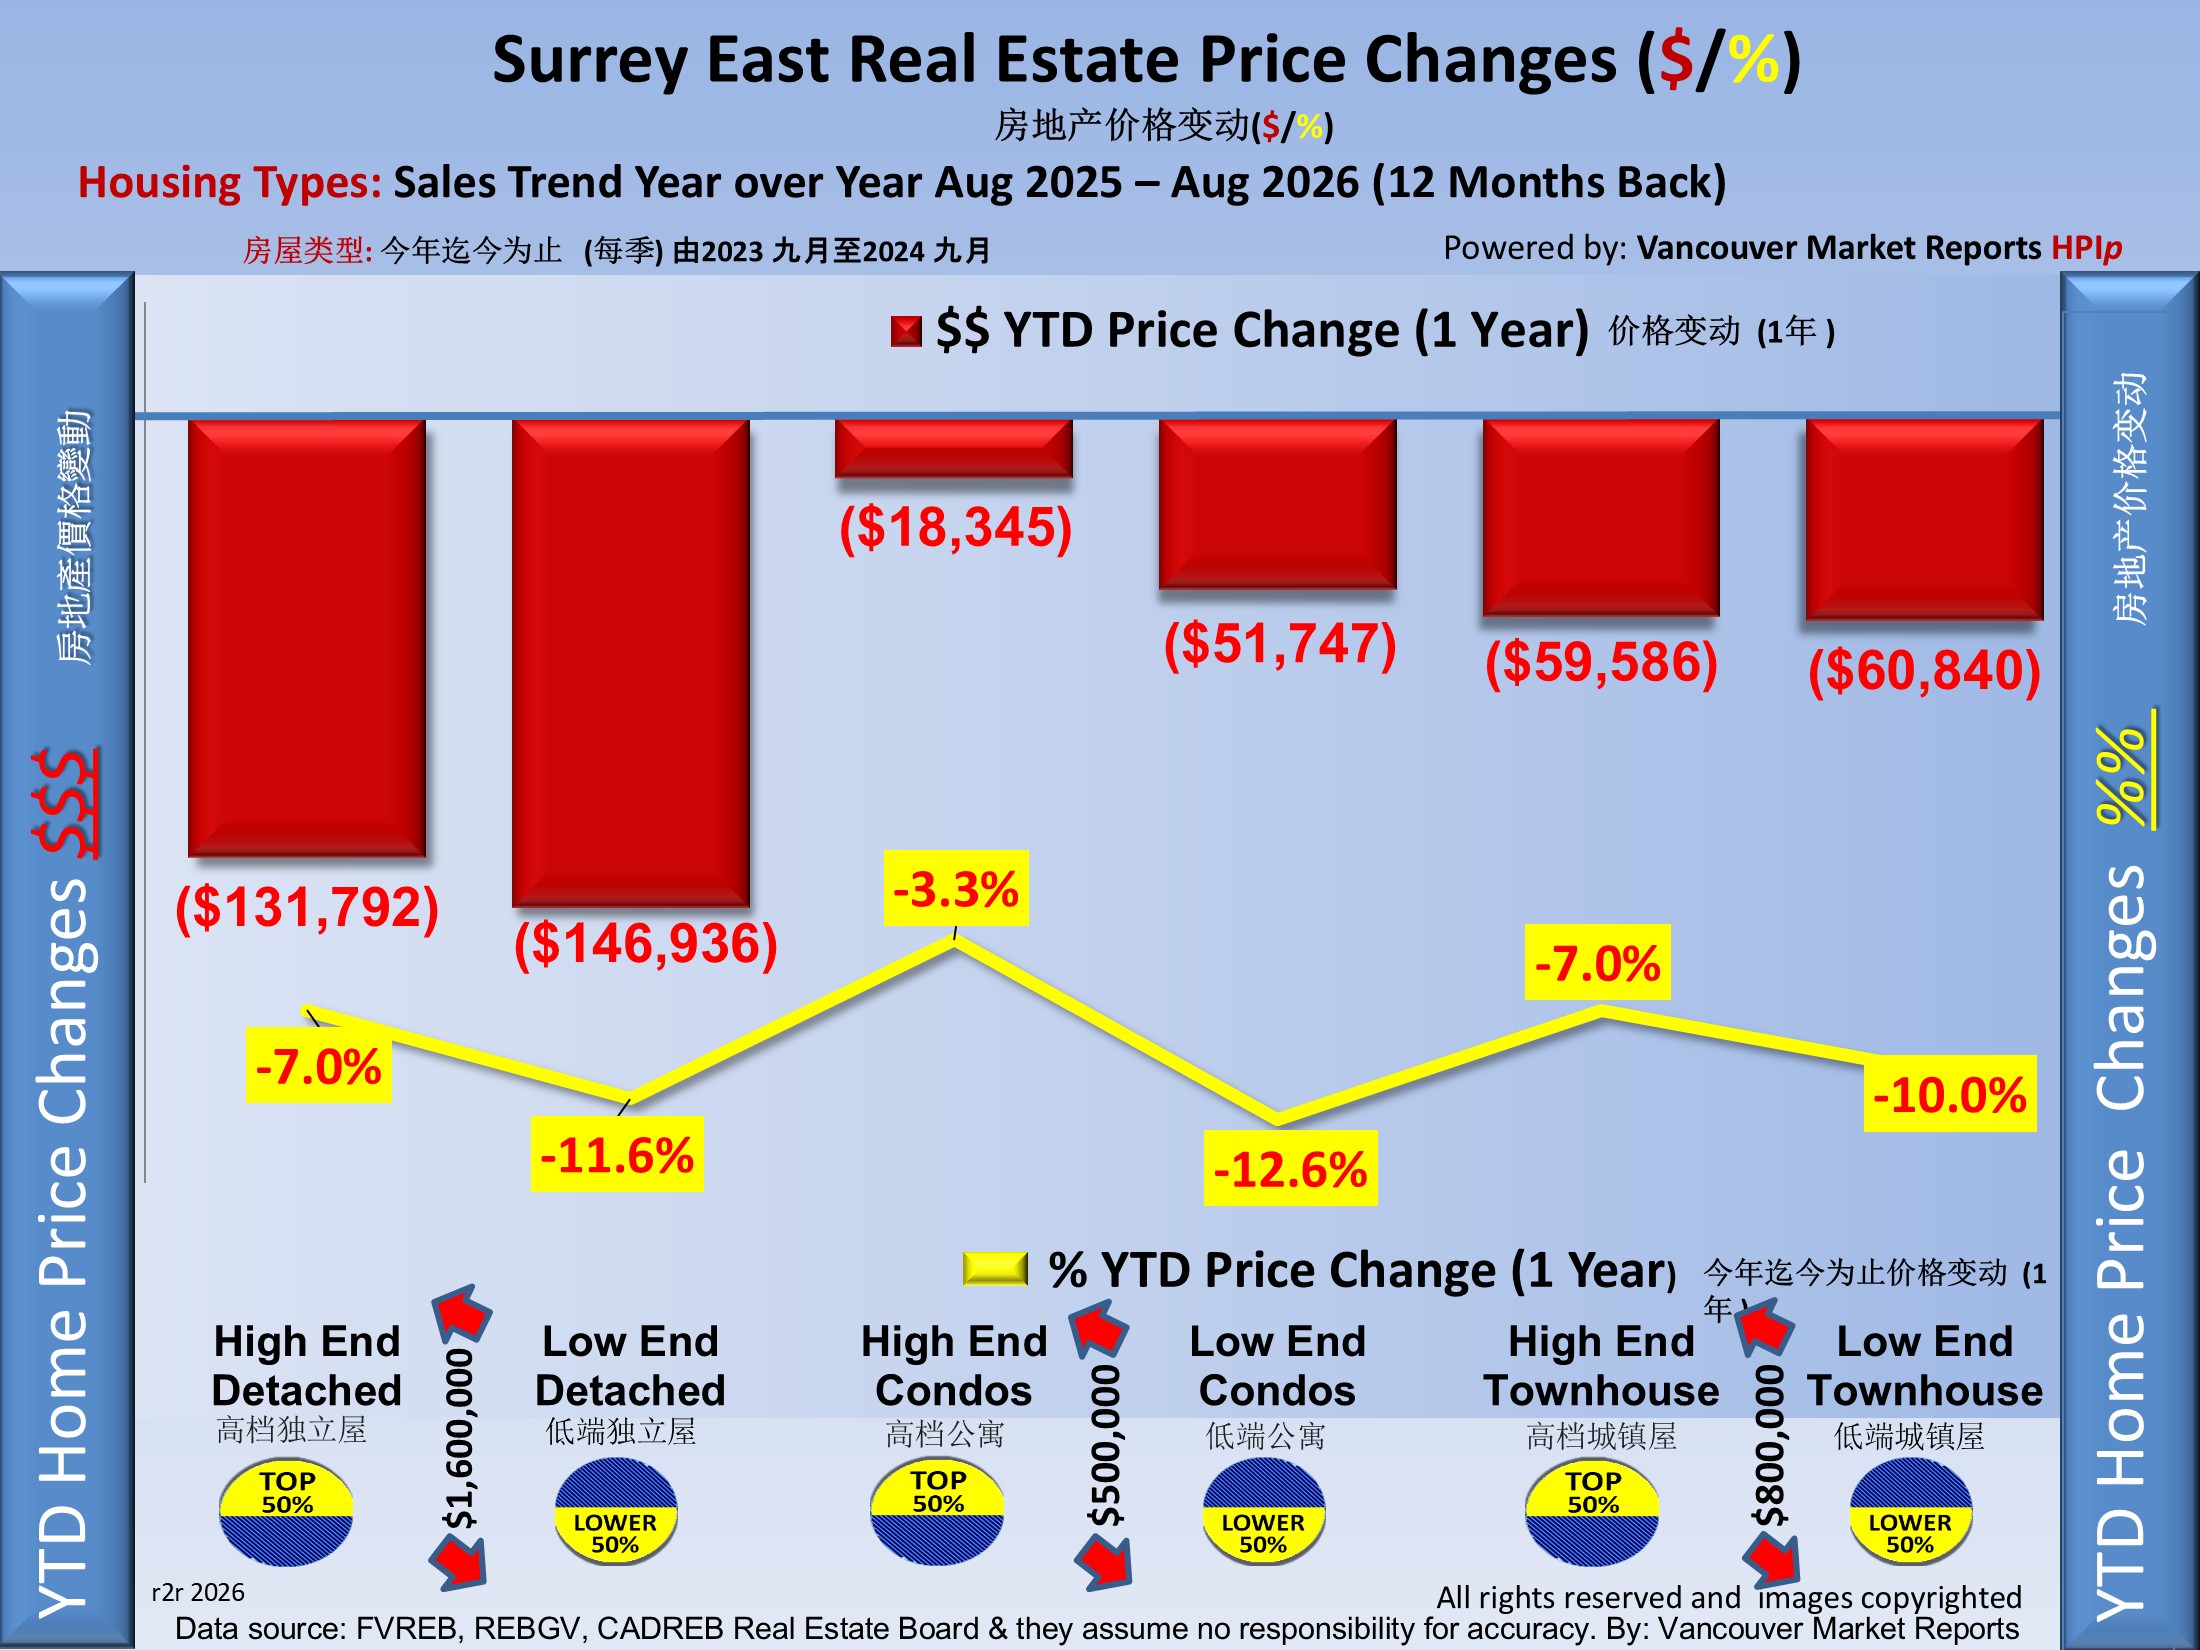
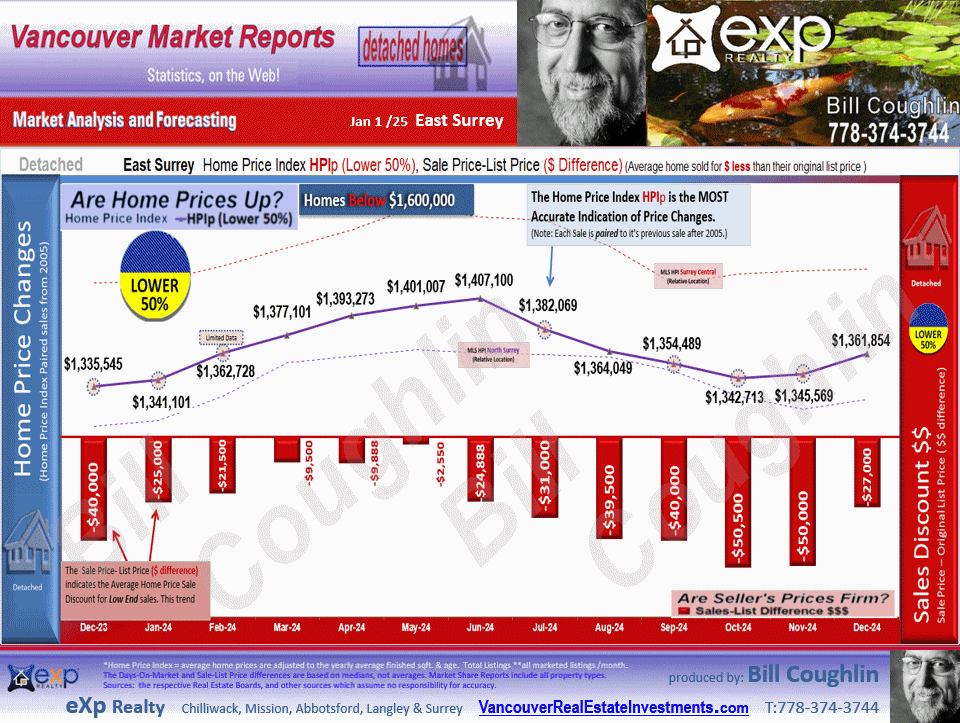
History: The Surrey East Year-To-Date Home Price Index HPIp (Top 50%) shows that prices decreased $119,896.
The Surrey East Year-To-Date Home Price Index HPIp (Lower 50%) shows that prices decreased $96,044.
*The HPIp (Home Price Index) is an approximate reflection of the Average Home Price Changes.
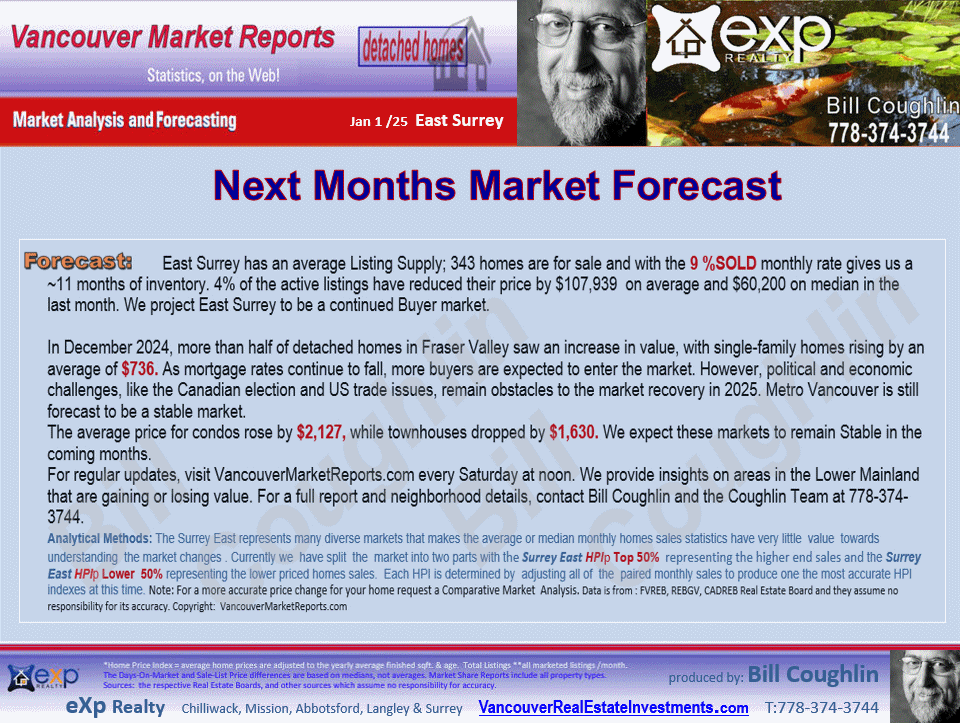
Forecast: East Surrey has an average Listing Supply; 496 homes are for sale and with the 6 %SOLD monthly rate gives us ~16 months of inventory. 10% of the active listings have reduced their price by $77,194 on average and $59,901 on median in the last month. We project East Surrey to be a continued Buyer market.
Greater Vancouver September 2026:
Home Prices Are Still Falling! But There’s Some Good News!
Greater Vancouver detached home prices dropped an average of $16,504 in September, compared to $22,911 in August. That's a 28% smaller drop! However, 81% of detached home markets are still declining. Condo prices fell $4,797, with 78% of markets dropping. Townhomes took an even bigger hit, falling an average of $8,593, with 87% of markets declining! Canadian consumer confidence is extremely weak. American tariffs are forcing Canadian businesses to close, lay off staff, or move south. We forecast more job losses next month = more downward pressure on home prices! But this market could turn around! If Canada & the US reach a trade agreement with lower tariffs, businesses could regain confidence & start hiring again. If interest rates dropped 1.5%, banks made financing easier & governments offered buyer incentives, sales could recover! EG: FOR 6 MONTHS, remove GST on new homes & property transfer taxes on all sales. This would encourage buyers to step back into the market! Bottom Line: Restore jobs, lower interest rates & reduce buying costs = more buyers, more sales & a stronger housing market!
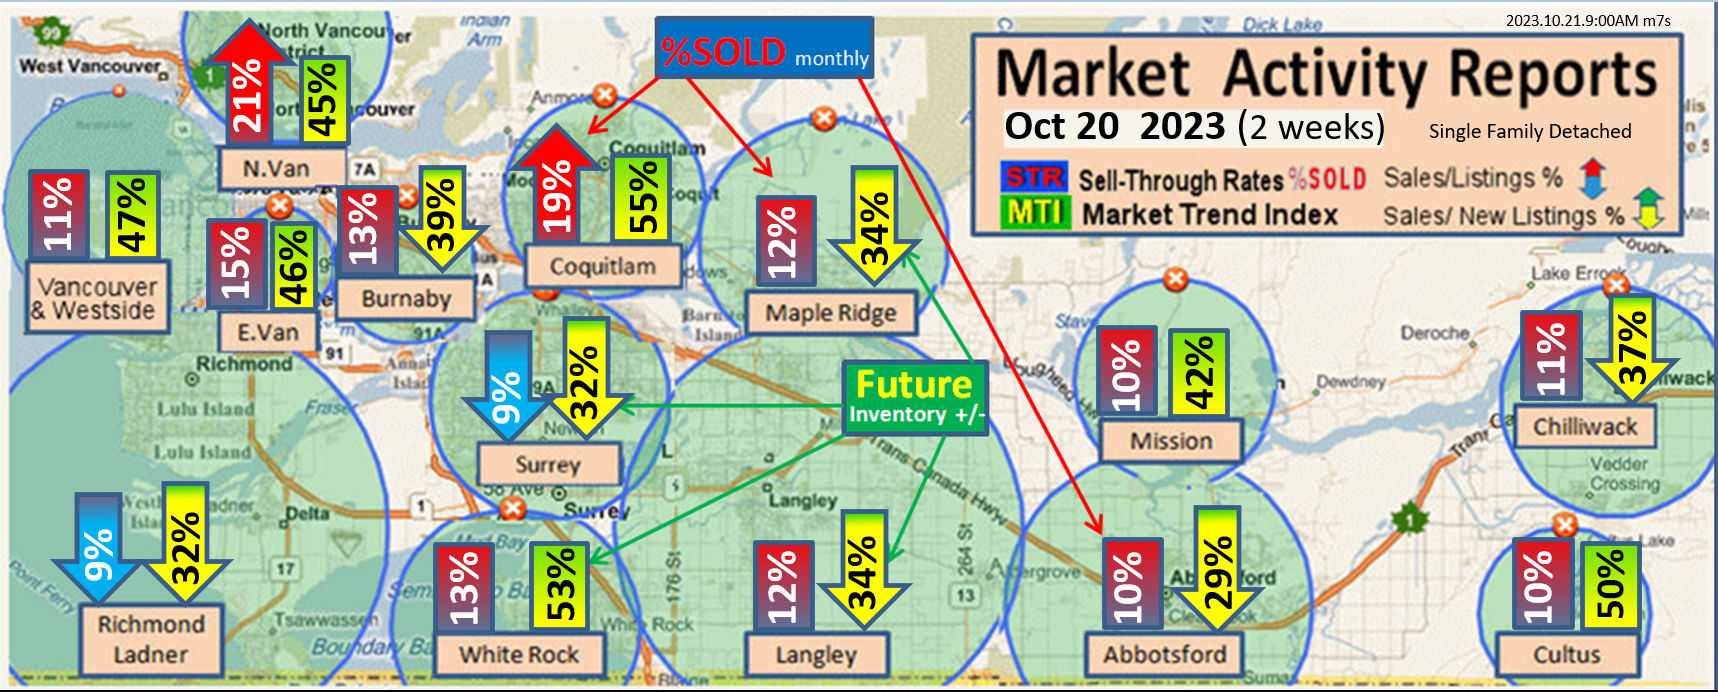
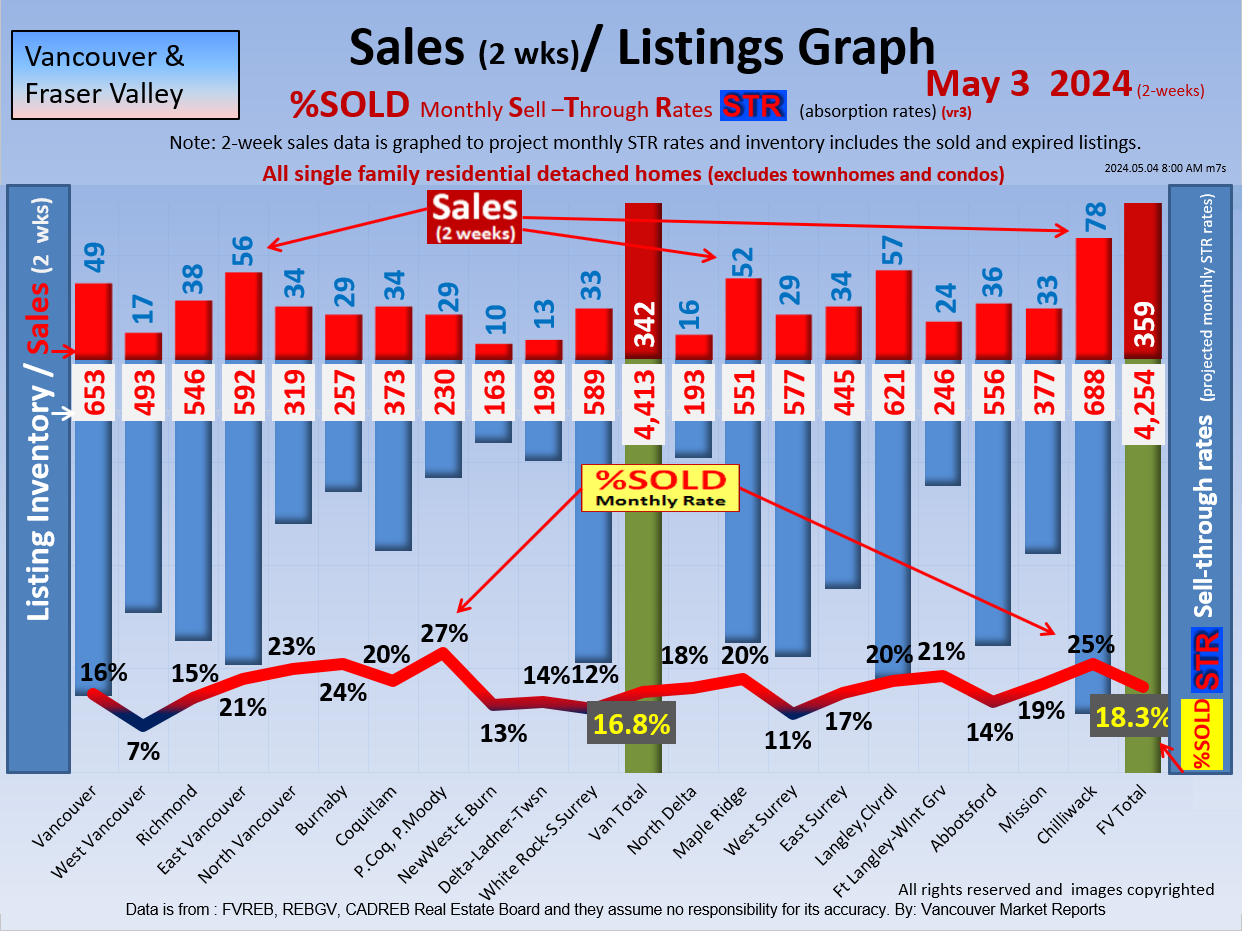
Want to know how your neighbourhood is performing? Visit VancouverMarketReports.com every Saturday at noon for the latest Sell-Through Rates across all 17 cities. For expert advice or a free home market review, call Bill Coughlin and the Coughlin Team at 778-374-3744. We’re here to help you understand the market and make the best move.
Fraser Valley September 2026:
Good News! Detached Home Prices Are Falling Slower!
Fraser Valley detached home prices dropped an average of $5,589, compared to $10,687 in August. However, 56% of detached markets are still declining. Condos fell $3,717, with 83% of markets declining. Townhomes took the biggest hit, dropping $9,208, with 92% of markets falling! Bottom Line: Detached homes are showing improvement, but condos & townhomes remain under pressure. Buyers have stronger bargaining power! Sellers need competitive prices to attract serious offers. Canadian consumer confidence is extremely weak. American tariffs are forcing Canadian businesses to close, lay off staff, or move south. We forecast more job losses next month = more downward pressure on home prices! But this market could turn around! If Canada & the US reach a trade agreement with lower tariffs, businesses could regain confidence & start hiring again. If interest rates dropped 1.5%, banks made financing easier & governments offered buyer incentives, sales could recover! EG: FOR 6 MONTHS, remove GST on new homes & property transfer taxes on all sales. This would encourage buyers to step back into the market! Bottom Line: Restore jobs, lower interest rates & reduce buying costs = more buyers, more sales & a stronger housing market!
Want to know how your neighbourhood is performing? Visit VancouverMarketReports.com every Saturday at noon for the latest Sell-Through Rates across all 17 cities. For expert advice or a free home market review, call Bill Coughlin and the Coughlin Team at 778-374-3744. We’re here to help you understand the market and make the best move.
|